The health of petroleum wells
How do you check that a petroleum well is leak-proof, so that it cannot endanger the environment or the platform staff? To do so, you’d have to investigate a narrow hole with a diameter of maybe 30 cm, kilometers below the ground, where the temperatures can reach well above 100°C and the pressure is crushing. This may sound difficult, and it is! Even so, the petroleum industry has been doing things like these for almost a century, and over the past four decades they have increasingly been using ultrasonic techniques.
My colleague Andreas Talberg previously wrote a blog post about cement evaluation using the pitch-catch ultrasonic technique. In this blog post, I will explain how petroleum companies use well log measurements to evaluate the health of their wells, and touch upon some of the ways that we at the Centre for Innovative Ultrasound Solutions (CIUS) want to help them along.
What is a petroleum well?
A petroleum well is basically a deep hole in the ground, from the surface down to a petroleum reservoir. The well contains steel pipes, to keep the hole from caving in and to carry the petroleum from the reservoir to the surface. In some parts of the hole, there is cement between the pipes and the rock walls of the hole. The cement keeps the pipes in place and forms a tight seal. This seal ensures that the petroleum has only one way to flow up, namely through the pipes where the flow can be controlled.
That is what a healthy well looks like, and petroleum companies have to ensure that their wells are built healthy and stay that way. If, say, the cement does not seal the well completely or the pipes become extremely corroded, petroleum may leak from the reservoir. This represents both an environmental hazard and a safety hazard for the platform staff, and must naturally be avoided. Therefore, petroleum companies have to measure the state of their wells, which tells them whether the wells are healthy and helps them figure out what to do if they are not.
What is a well log?
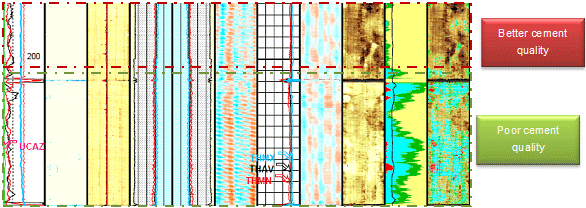
There are a number of different types of measurements that can be done in a well: Ultrasonic, sonic, radiometric, mechanical, electromagnetic, and so forth. You can do any number of such measurements by sending the appropriate tools down into the well. The measurements are transmitted back up, where they are processed. The results can then be shown as a well log, like the one below.
A well log looks quite confusing at first, and it may come as no surprise that learning to read one takes a lot of training. In short, however, each of the “columns” represents one or more types of information, drawn from the measurements that were done in the well.
Based on this information, experienced log interpreters can get a very good idea of the health of a well. For example, for a well with a steel pipe with cement on the outside, they can tell whether the pipe is corroded or otherwise slightly deformed, and whether there are any fluid channels between the cement and the pipe through which oil or gas could feasibly leak.
In this particular log, everything except for some of the curves in the leftmost and second rightmost column has been determined by the Ultrasonic Imager tool (USIT), an ultrasonic tool by Schlumberger. This tool uses a pulse-echo technique, which means that it shoots ultrasonic pulses straight at the pipe wall and records the echo that comes back. (This is somewhat different to the pitch-catch technique that Andreas wrote about.) As the tool is pulled through the well, it spins around, taking measurements in every direction. By processing these measurements, which typically look similar to those shown below, we can get a good idea of the shape and thickness of the pipe, and what material lies behind it.

How CIUS can help
As part of the CIUS collaboration, Equinor has released a large well log data set to CIUS, in addition to the Volve data set that they have released to the general public. These data sets include both raw measurement data and previously processed data based on these measurements. With these data sets and our expertise in ultrasonics and machine learning, we want to help give log interpreters an even better basis for making their evaluations.
There are several directions we want to go with this, and I will give a few examples. First, we believe that there is more information to be found in the measurements than what is drawn from them today. By developing better data processing techniques, we would provide log interpreters more information so that they can make evaluations with even more certainty.
Second, we want to help log interpreters with the easy parts of their task so that they can concentrate on the more difficult ones. By giving them extra decision support, for example through automatic suggestions for well log interpretations, we let them change the focus of their work towards the more challenging situations that require a skilled human to evaluate.
We are still in the early stages of this work, but when the results start coming in, we will let you know!
All images and data shown here are taken from the Volve Data Village data set that Equinor has released freely to the public, and are used with explicit permission.
