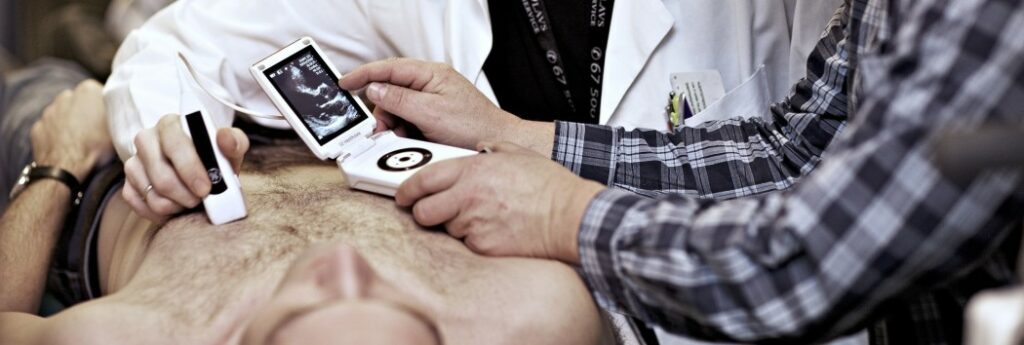
Improving ultrasound imaging of obese patients
Obesity has reached alarming levels worldwide, affecting individuals of all age groups. According to the World Health Organization (WHO), global obesity prevalence has nearly tripled since 1975. In 2016, over 1.9 billion adults were overweight, with more than 650 million classified as obese. In addition to the health risks these patients face, they have the additional problem of being difficult to image using ultrasound, which means doctors have to use more invasive, and often more expensive, imaging modalities.
One of the reasons ultrasound image-quality degrades for obese patients is related to the speed of sound in tissue. Conventional ultrasound scanners assume a constant speed of sound of 1540 m/s when creating images. However, the physical speed of sound in soft tissue varies, with muscle tissue having a speed of 1575 m/s and fatty tissue having a speed of 1450 m/s. Adapting the image formation to the patient’s speed of sound will result in a more accurate representation of structures and higher image quality.
Studies have shown that clinicians with the ability to modify the sound speed parameter on the ultrasound system, achieve faster examination time and obtains higher quality images. These studies used a manually tuned value, but the tuning can also be done automatically. The automatic correction of sound speed and improved image quality is the goal for our work.
The adaption and correction of the sound speed for a patient involve estimation- and correction methods. Our method tweaks and turns the sound speed back and forth until it finds the correct value for every pixel. What is correct is determined by how similar signals look after focusing. This is a traditional method of finding the sound speed and is used to image the Earth’s subsurface in the field of seismology.
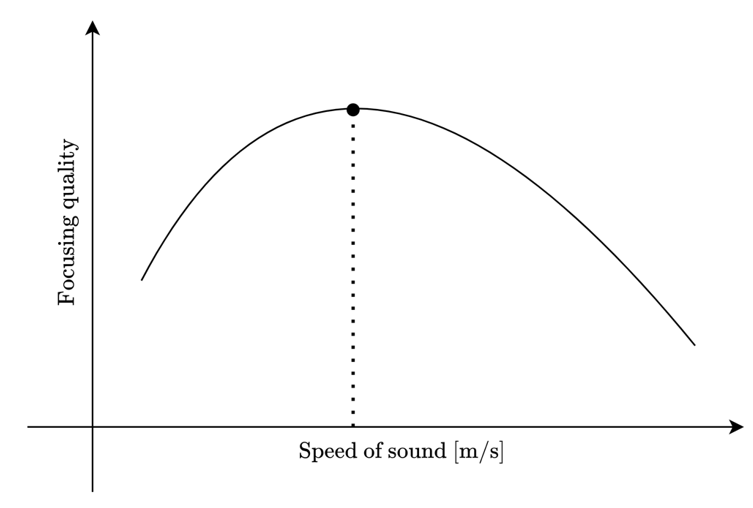
We have adapted the method to use it in medical ultrasound and estimate the speed of sound using a simplified version from what is done in seismic imaging. The graph below illustrates how we choose the speed of sound with the highest focusing quality.
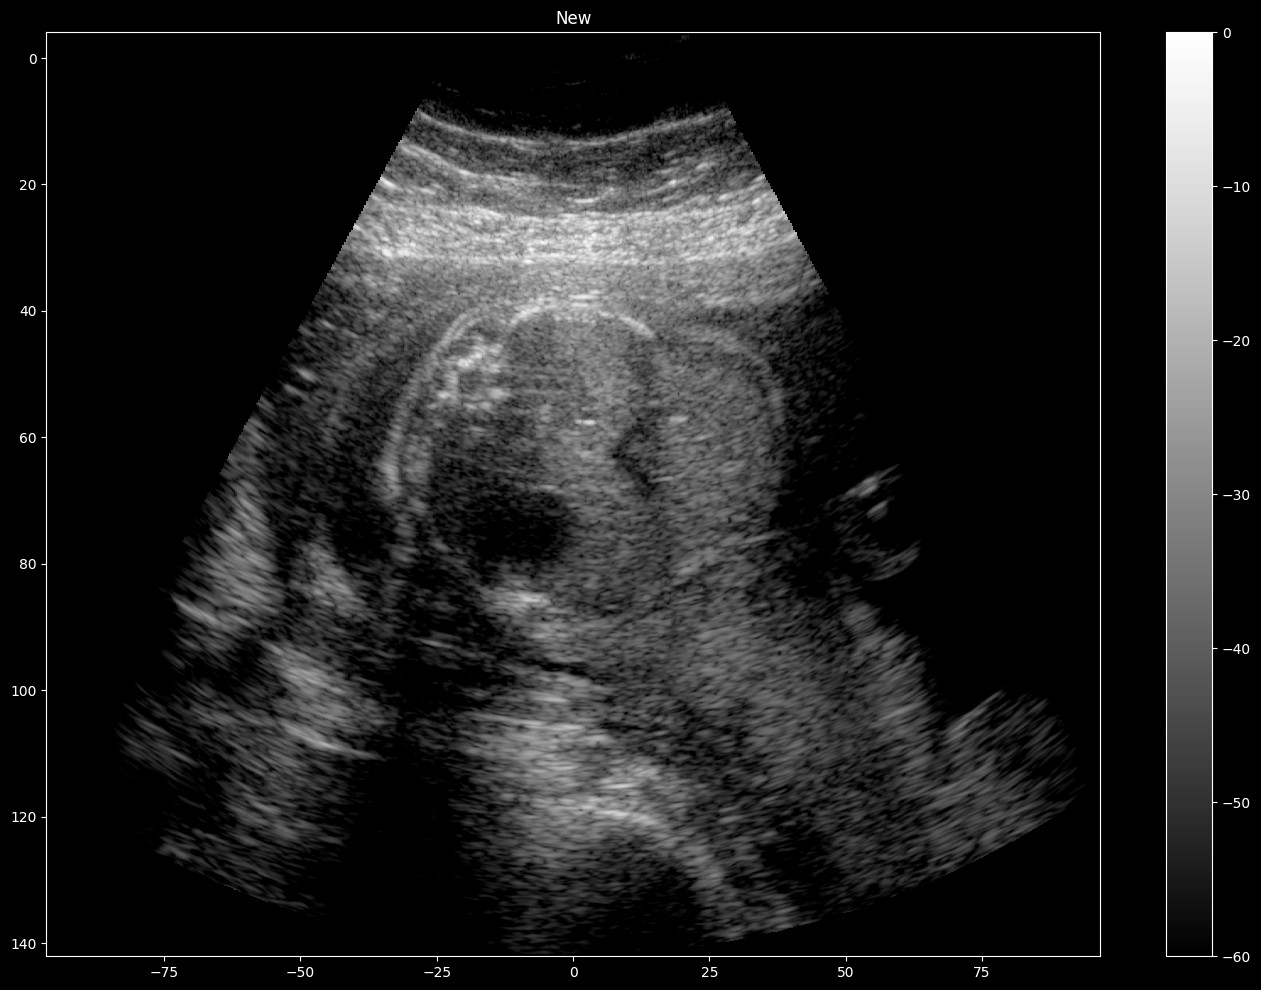
In the GIF below, you can observe the quality of a foetal ultrasound image before and after the correction. The GIF alternates between the “old” method using a sound speed of 1540 m/s and the “new” method using an estimated sound speed map. We can see some structures are moving, the resolution of point targets is improved, some of the borders become better defined and contrast is gained.
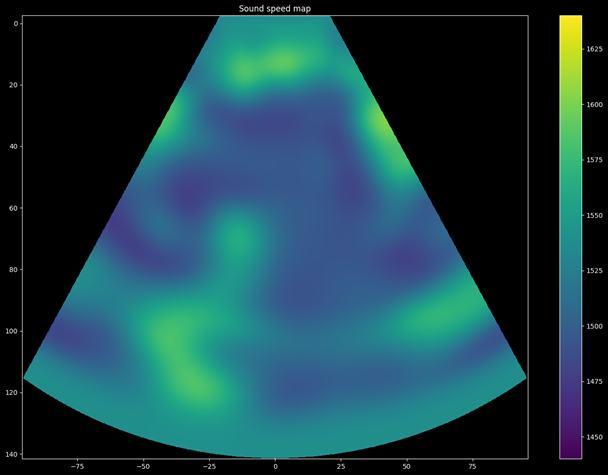
Furthermore, the estimated sound speed map for this foetal scan is shown below where yellow indicates a higher sound speed and dark blue indicates a lower speed. This map shows the average speed of sound from the imaging apparatus to the pixel and back. A map of the sound speed in the body may also be used in future as a diagnostic tool.
The results presented in this article are promising and suggest the potential for new technologies better suited to imaging obese patients. Our ongoing work includes further improvements to the method and validation through simulations. The work will soon be published.
Follow me on LinkedIn or Google Scholar for future publications.
