


 17 / 80

17
Annual Report 2016
SAMCoT
Thermodynamic consolidation of ice ridges occurs due
to atmospheric cooling from the surface and due to the
freshening of the water trapped inside the rubble caused
by the rubble melting. The latter process is very slow
when the oceanic heat flux to the ice bottom is small
(<10 W/m
2
) and develops faster when the rubble drifts
to warm water areas.
WP1 researchers studied the consolidation of ice rubble
in the region of Bjørnøya. The ice drift and water surface
temperature reconstructed from the data from the
spectroradiometer MODIS flown on two NASA spacecraft
(Terra and Aqua) show that sea ice tongues drifted se-
veral times in March 2016 from the North to the region
with water surface temperature around 0 - +1
⁰
C under
the influence of Polar cyclones formed near Bjørnøya.
Oceanic heat flux to the ice bottom, estimated for
these conditions with standard formulae, can reach
CONSOLIDATION OF ICE RUBBLE IN WARM WATER
100 W/m
2
and higher. Numerical simulations performed
with the original model of thermodynamic consolidation
show that rubble ice with a macro-porosity of 20%
can be completely consolidated in 1-2 months. At the
same time, the rubble draft decreases due to melting.
Therefore drifting ridges are transformed into relatively
large consolidated sea ice features with vertical scales
of several meters which are similar to “bergy bits”.
These ice features create potential risks for
navigation near Bjørnøya. Predictions could be made
using satellite information and ice maps.
WP1 researchers are very excited by these findings,
and hope to further study and analyze the consolidation
of ice rubble in warm waters. One example of such
ice features was spotted near Edgeøya during the RV
Lance expedition in May 2016. WP1 researchers have
discovered that this rubble has been forming by the
accumulation of ice that drifts from the North.
This mass showed a concentration of 20 icebergs per
km
2
with an average size of 20*40 m. N. Marchenko
scanned this huge ice rubble field and processed point
clouds from the scans using the RiScan and ArcGIS
programs. In addition, she studied high-resolution
satellite images of the same mass to obtain further
information on the structure and origin of the ice rubble.
She discovered that the rubble mass existed from the
beginning of April to the beginning of July.
On the basis of data obtained from IFREMER and WP1
Ice trackersit was concluded that these ice features
may reach Bjørnøya in two and a half months in cases
when average drift applies. However, when polar
cyclones and strong wind gust are observed, the drift
can be much faster and these ice features or remnants
of them may reach Bjørnøya in a month. Terra satellite
images show that the ice tongues reaching Bjørnøya
were visible every March 2015 – 2017.
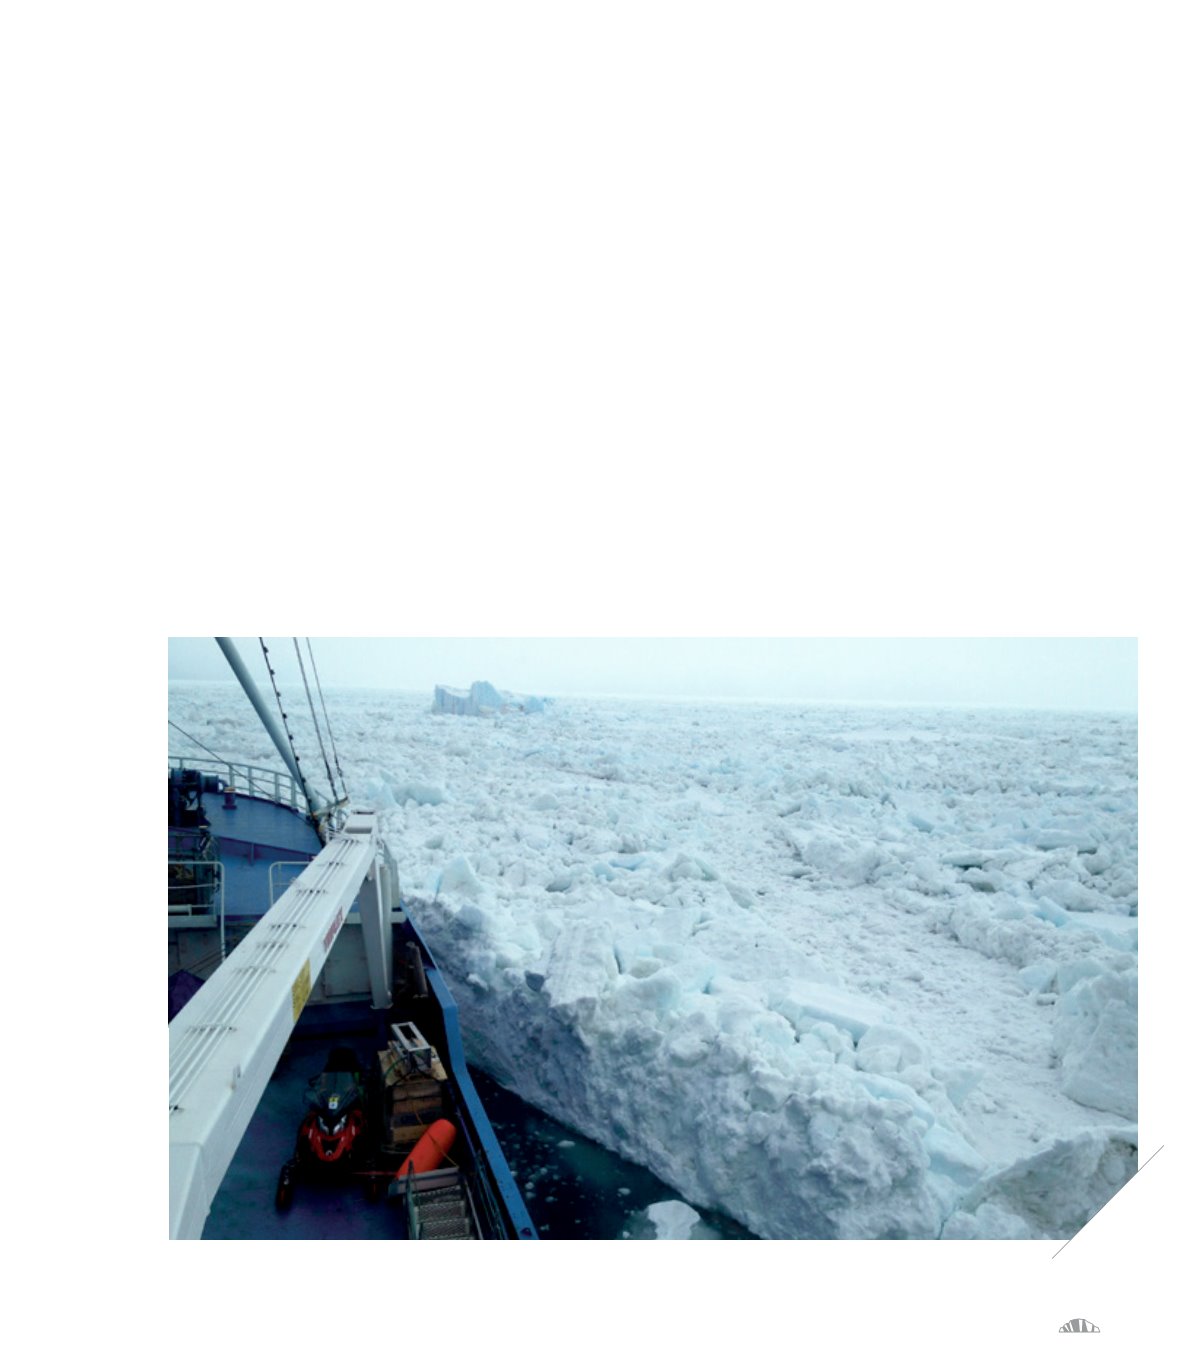
Ice rubble observed near Edgeøya during the Lance cruise on 2 May 2016. Vertical wall: 3 m; average elevation above water: 2 m;
width from coastal line: 8 km; stretching in N-S direction along the coast: >20 km.