Automating heart monitoring
Heart disease is a major public health issue, and every year, more than 100,000 heart valve operations are performed in the United States alone. With these kinds of numbers, it is more and more urgent to simplify diagnosis and monitoring of heart patients. I/we believe automating the interpretation of ultrasound results is the way forward.
Minimally invasive heart surgery is taking over more and more, as it uses a tiny cut in the skin or no cut at all relying on x-ray and ultrasound guidance. It is usually less painful and the patient recovers faster. We believe that we can improve this further by introducing machine learning.
Automated assistance for cardiologists
Ultrasound is used to monitor the patient before surgery, to plan for surgery, and to check that everything is going according to plan afterwards. However, ultrasound images are quite noisy and evaluating them requires experienced cardiologists and time. Our goal is to allow the medical staff to spend less time analysing data, and more time with patients. We also plan to avoid inconsistent interpretations by introducing automated tools to analyse ultrasound images. In our case, we are more specifically interested in transoesophageal echocardiogram (TEE) which is an ultrasound recording taken by placing a probe in the oesophagus of the patient.
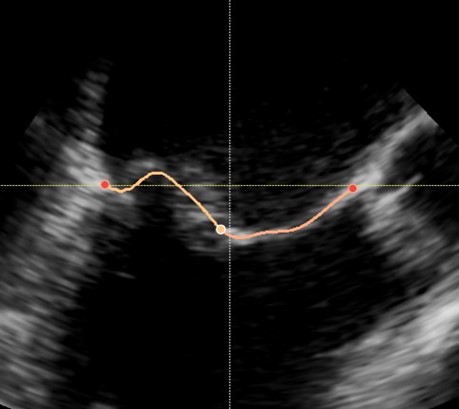
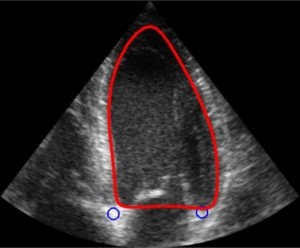
For this project, we are especially interested in the mitral valve (see figure below), which is the separation between the two left heart chambers. In the case of mitral valve regurgitation affliction, also known as leaky heart valves, the patient’s state needs to be monitored over time. For this, we need consistent measurements, which have been proved to be better when using software for automated detection of points of interest – i.e. landmarks. The same goes while planning for surgery: we need precise measurements of the mitral valve perimeter, the chambers volume, etc.
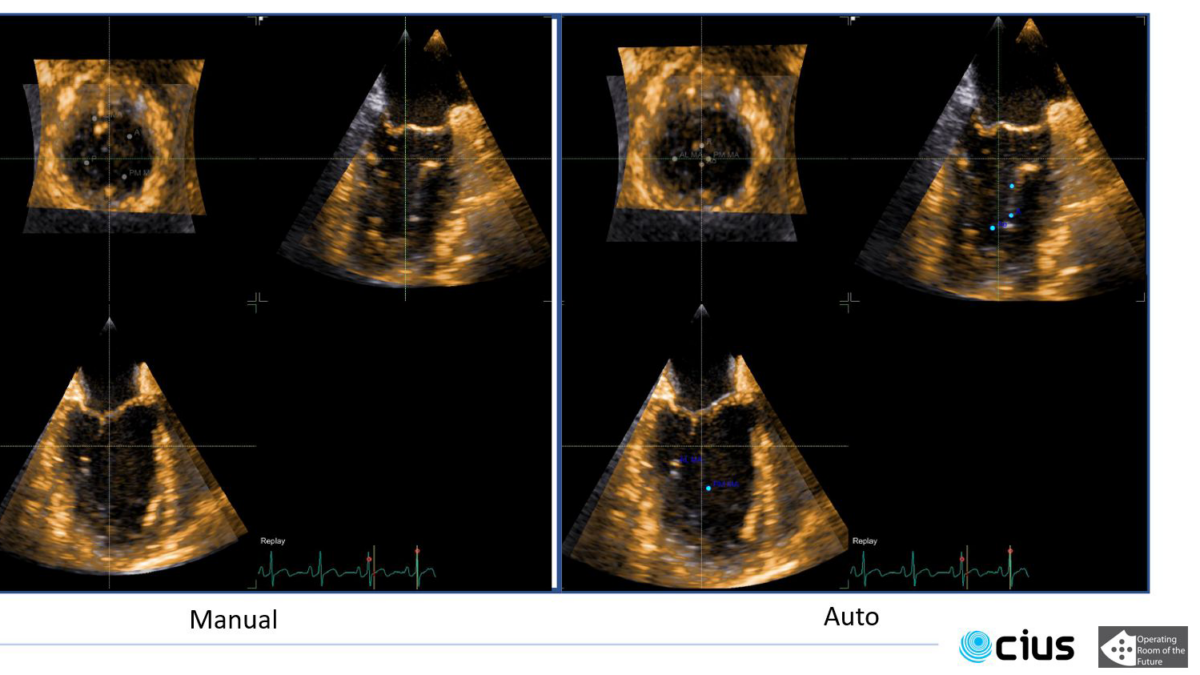
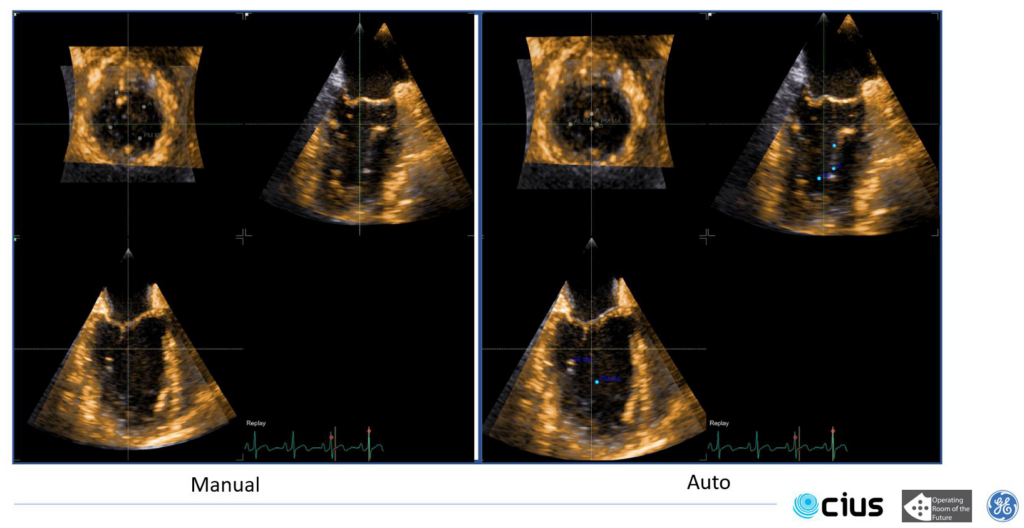
Some work has already been done in the field where segmentation is performed over a few specific frames: either closed or open mitral valve (systole or diastole). This yields a very flickering segmentation over a full heart cycle, leading to poor predictions.
Adding a fourth dimension
Our goal is to track mitral leaflets in 3D throughout the complete video sequence. By adding a fourth dimension to the way we study the data – time –, we hope to automatically predict measurements to make it easier for cardiologists to monitor their patients and plan for surgery if necessary. We will divide the tracking into two main steps:
- track landmarks on mitral annulus/leaflets
- track and segment mitral leaflets
This will be done using machine learning, specifically neural networks. called transformers and auto encoders.
‘Transformers neural networks’ are based on attention, i.e., they select an area of the data to concentrate the search, and are made to work on sets of data – in this case a video. We are working on tracking the different position of leaflets between two frames.
Auto encoders on the other hand are made to encode data, which can be useful in several ways:
- Diminishing the size of the data
- Getting a trace of the data containing elementary features
But they don’t understand the concept of ‘time’ like Transformers.
As 3D data is heavy and the hardware available in the hospital is restricted, we need to combine the best of these two methods to obtain a tracking tool that is usable in the clinic.
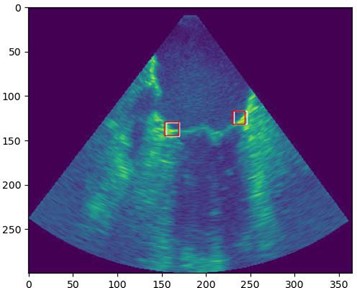
We have already started to adapt Transformers architecture to track the area between mitral leaflets and the heart chambers walls (see figure above).
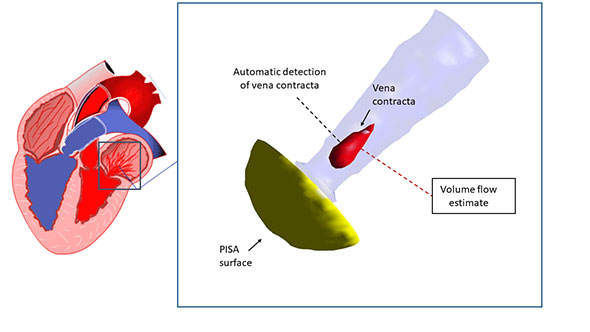
Once 3D tracking is achieved, a possible extension of this work would be to go from ultrasound imaging to 3D visualisation and quantification of the mitral annulus. This will allow for better diagnosis of the function of the mitral valve. This will allow better quality imaging