Basic HTML Version


32
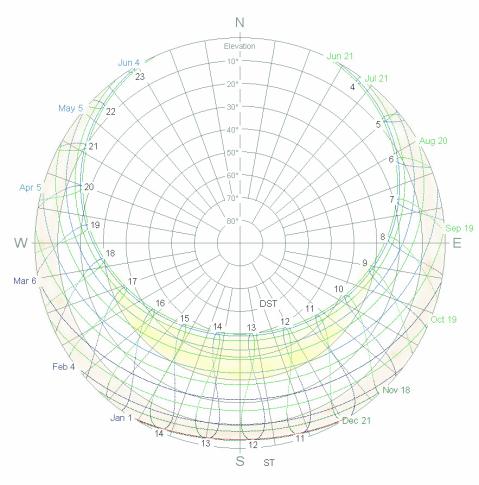
Figure 6. The sun diagram for Trondheim generated using the Solar
Beam software. The area of the diagram representing 0°-10° elevation
angles of the sun is marked with red and the area representing eleva-
tion angles over 30° with yellow.
Figure 8. The frequency of sunny skies during the year: Nordic region to the left, Europe to the right.
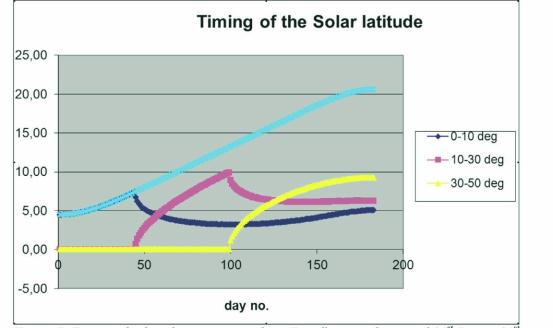
Figure 7. Timing of solar elevation intervals in Trondheim in the period 21st
Dec. – 21st June. The intervals are 0-10°, 10-30° and 30-50°. The white line
represents daytime, i.e. from sunrise to sunset.