Basic HTML Version


106
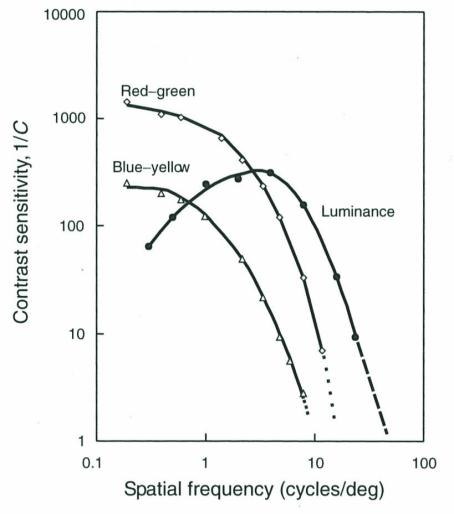
Figure 1. Spatial contrast sensitivity for luminance and isoluminant
chrominance gratings. The sensitivity curves for pure color differen-
ces resemble low-pass filters, while the curve for luminance contrast
sensitivity corresponds to a band-pass filter. When using a common cone
contrast measure for luminance and chrominance, the results can be
compared, and we see that contrast sensitivity is best for a red-green si-
nusoidal grating of low spatial frequency. Resolution is best for luminance
contrast. The data are averages of 10 subjects (Valberg, 2005): 260).
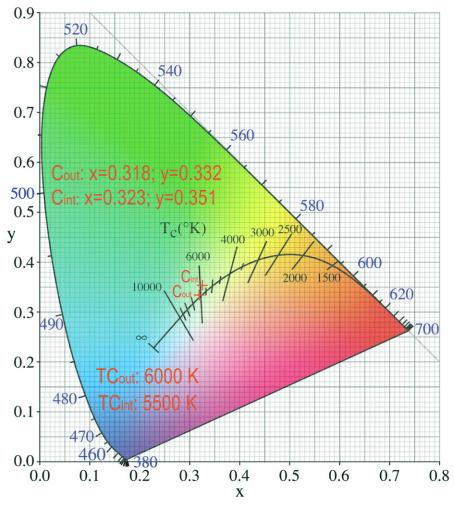
Figure 2. Correlated colour temperature of the Artificial Sky.
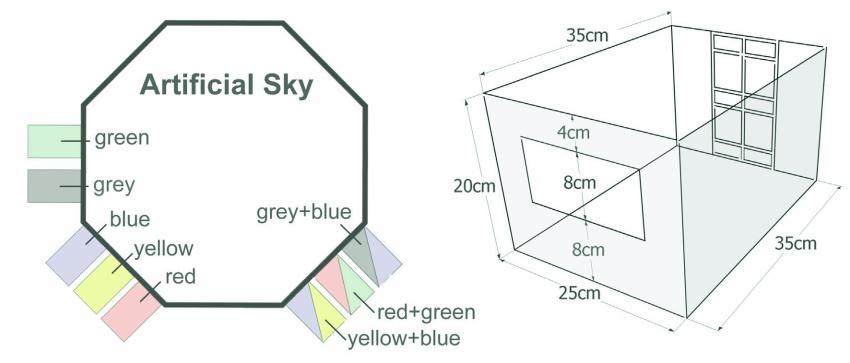
Figure 3. To the left: arrangement of the models in the laboratory under Artificial Sky during experiment, photographing and measuring illuminance. To the
right: form and sizes of scale models